支招小作文 | 线图很简单!以6月29日真题为例
2019年07月03日 05:08来源:昆明编辑
摘要:支招小作文 | 线图很简单!以6月29日真题为例
2019年6月29日真题
国内A类:线图
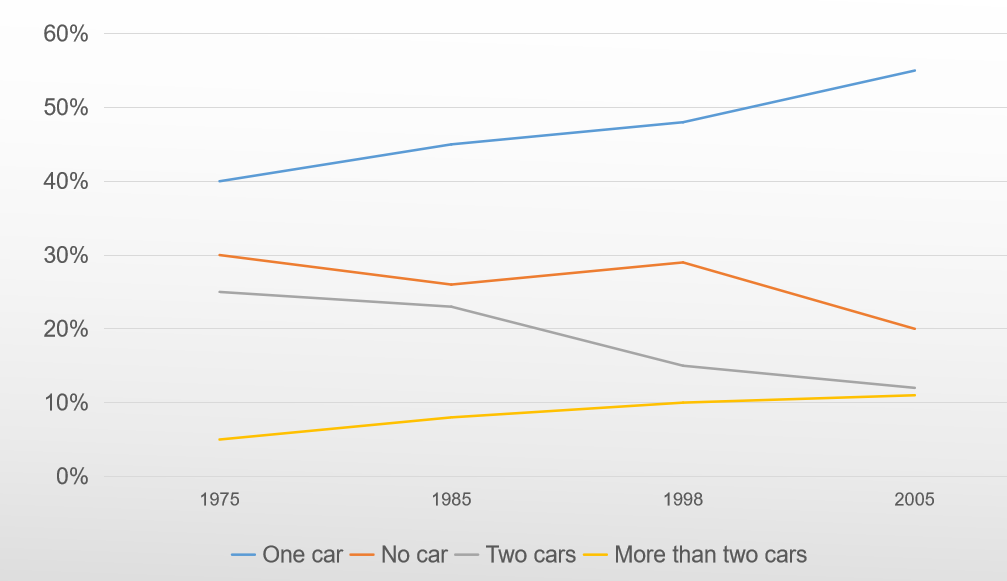
The graph below shows changes in percentage of households owning the car in the UK between 1975 and 2005.
高分范文及写作解析
示范与破解 1
Introduction 略
Body 第1段
黑色为学生习作。橘红色为教师修改。蓝色为教师注释讲解。
The percentages of families owning one car and those owning more than two showed a similar trend over the 30 years. Portion of families having one car increased steadily from 40% in 1975 to 55% in 2005. The increase in the other number was slower, as the portion was just above 10% in 2005, 5% more than that in 1975.
☝☝☝
描述数据本身(罗列数据)
描述当时的情况(事件感)
☟☟☟
Both households with one car and those with more than two cars becameproportionally more constantly; however, the ownership 「找到这个主语句子的描述就多样了」 grew at different rates ←从general pattern/trend 到 specifics → With a 15-percent increase, one-car ownership 「找到这个主语句子的描述就多样了」 reached a rather high level (55 percent), and meanwhile, the percentage of households that own more than two cars remained at a fairly low level (10 percent) after a 5-percent increase.「把数值放在括号里写,句子的结构就不会被破坏」
Body 第2段
Decreases in the portion of households with no car and those with two were at similar low rates in the first ten years. After 1985, however, households with no car became proportionally more, reaching 29 percent in 1985, but in the following ten years, their proportion dropped by 10 percent. Two-car ownership, on the other hand, remained decreasing and dropped to a fairly low level at 11 percent in 2005.
直接描述细节
先总述宏观后挑选重要细节,写出“结构感”
The 30-year period saw an overall slip in both of the other types of households. ←先描述整条线的宏观/总情况/general情况,写出“事件感”,再按照时间顺序描述细节→ After a ten-year slow decrease, households with no car grewproportionally to nearly 30 percent – the original level, while the proportion of those with two cars continued falling and fell to roughly 15 percent. During the subsequent years, a further slide occurred to the two-car ownership, and there was a fall in the other ownership.
Conclusion 略
示范与破解 2
The chart illustrates the change of how many cars are owned per household in the UK over a 30-year period from 1975 to 2005.
Owning only one car was always the commonplace among UK families. 「写法上注意避免机械描述数据,而写出“陈述一个发生过的(历史)事件”的感觉。」This type of ownership already accounted for 40 percent in 1975, and more than half of the UK households owned one car 30 years later. Similar to 「逻辑关系的体现」 this type of ownership, owning more than two cars also had a growing / an upward trend. 「如果可以写出话语感比较好而不像纯粹介绍数据,分数更好」However, the difference 「逻辑关系的体现」 is that the proportion of households with more than two cars grew slowly and stayed at low levels (from 5 percent to 10 percent). 「难得出现纯粹数据描述样式的措辞」
On the contrary, the two-car ownership is decreasing, with the percentage dropping by half on the original level (25%), and the period from 1985 to 1995 witnessed the most marked decrease (8%). In addition,「不要把线切碎」having no cars became even less common overall by a 10-percent decrease, despite a slight increase during 1985 and 1995.
Overall, the UK 「还未使用过的主语」 saw a continuous increase in the households’car possession over the years.
免责声明
1、如转载本网原创文章,请表明出处;
2、本网转载媒体稿件旨在传播更多有益信息,并不代表同意该观点,本网不承担稿件侵权行为的连带责任;
3、在本网博客/论坛发表言论者,文责自负。
相关内容
- 雅思写作三要素
- 雅思写作十大扣分点
- 基本结构写作技巧
- 作文怎么写结尾
- 雅思写作考试技巧
- 5月15日雅思大作文真题参考范文 I 保持身体
- 3分钟学会一个雅思7分句(第89期)
- 3分钟学会一个雅思7分句(第88期)
- 5月8日雅思大作文真题参考范文|年年驾考,
- 雅思写作致命错误是什么
- 雅思作文常用词汇介绍
- 3分钟学会一个雅思7分句(第87期)
- 3分钟学会一个雅思7分句(第86期)
- 3分钟学会一个雅思7分句(第85期)
- 4月26日雅思大作文真题参考范文 I 国际快餐
- 4月17日雅思大作文真题参考范文 | 为什么节
- 3分钟学会一个雅思7分句(第84期)
- 雅思写作衔接词使用常见问题
- 题的不写法
- 三步带你搞定流程图