支招小作文 | 梳理海量数据的办法
2019年12月15日 10:36来源:昆明编辑
摘要:支招小作文 | 梳理海量数据的办法
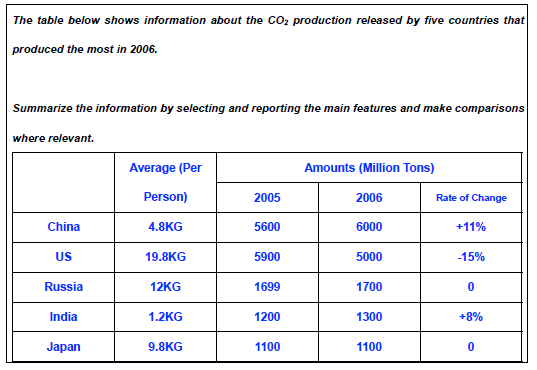
信息分组原则: 1、 找“最”值; 2、 发现区别大小; 3、 稳定性比较。 教师示范 The table is a statistical presentation of the CO2 production in five countries thatemitted the world’ most in 2006. 接下来,对于图表总况的陈述可以在开头段写(于是,就可以不在结尾段写): Overall, the five countries differed enormously in terms of the average amount of production and the change between 2005 and 2006. In terms of the individual average, The US and India were most notable,asthey had the maximum (approx. 20kg) and the minimum (1.2kg) respectively, and the emissions of the other countries were within a vast range of 4.8kg to 12kg. In terms of the total emissions, the US was notable again, asit ranked first in 2005 with nearly 6,000 million tons and, with 5,000 million tons, ranked just below China. The two years also witnessed China’s colossal amounts of emissions of CO2, which were 5,600 million and 6,000 million tons respectively. In Russia, India and Japan, the emissions were at markedly lower levels, between 1,100 million and 1,700 million tons. Meanwhile, the stability in Russia and Japan contrastedsharply with the stark change in the US, China and India (plus 11 percent, minus 15 percent and plus 8 percent).
免责声明
1、如转载本网原创文章,请表明出处;
2、本网转载媒体稿件旨在传播更多有益信息,并不代表同意该观点,本网不承担稿件侵权行为的连带责任;
3、在本网博客/论坛发表言论者,文责自负。
相关内容
- 雅思写作三要素
- 雅思写作十大扣分点
- 基本结构写作技巧
- 作文怎么写结尾
- 雅思写作考试技巧
- 5月15日雅思大作文真题参考范文 I 保持身体
- 3分钟学会一个雅思7分句(第89期)
- 3分钟学会一个雅思7分句(第88期)
- 5月8日雅思大作文真题参考范文|年年驾考,
- 雅思写作致命错误是什么
- 雅思作文常用词汇介绍
- 3分钟学会一个雅思7分句(第87期)
- 3分钟学会一个雅思7分句(第86期)
- 3分钟学会一个雅思7分句(第85期)
- 4月26日雅思大作文真题参考范文 I 国际快餐
- 4月17日雅思大作文真题参考范文 | 为什么节
- 3分钟学会一个雅思7分句(第84期)
- 雅思写作衔接词使用常见问题
- 题的不写法
- 三步带你搞定流程图
