直击考场 | 2018.5.5 Task 1线图参考范文
2018年06月04日 04:10来源:昆明编辑
摘要:直击考场 | 2018.5.5 Task 1线图参考范文
2018年5月5日雅思考试小作文题目
(国内A类):线图
☟☟☟
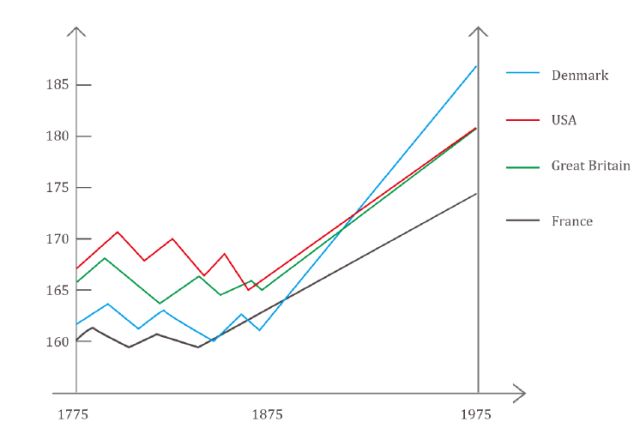
The graph shows the average height in different countries between 1775 and 1975.
Summarise the information by selecting and reporting the main features, and make comparisons where relevant.
小作文范文
☟☟☟
The line graph compares the average height in four countries(Denmark, USA, Great Britain, France)over two centuries from 1775 to 1975. Generally, all the countries experienced an upward trend in their average heights.
At the beginning, Americans with average height were the tallest at about 167 cm followed by British (166cm) and Danes(162 cm), whereas Frenchmen were the shortest at around 160 cm.
Then, between 1775 and 1875, although there were fluctuations, the average heights had almost remained the same in four countries; however, the datum of Frenchmen surpassed that in Denmark in 1850.
After that, the figures regarding the USA and Britain kept at a similar height with an ongoing rising trend to the same height of 180cm in the year 1975. At the same time, Denmark had seen a sharp increase of the average height exceeding that of the other three countries before reaching the peak in 1975 at almost 190 cm, which is a remarkable contrast with the French whose figure was about 173 cm in the end.
免责声明
1、如转载本网原创文章,请表明出处;
2、本网转载媒体稿件旨在传播更多有益信息,并不代表同意该观点,本网不承担稿件侵权行为的连带责任;
3、在本网博客/论坛发表言论者,文责自负。
相关内容
- 雅思写作三要素
- 雅思写作十大扣分点
- 基本结构写作技巧
- 作文怎么写结尾
- 雅思写作考试技巧
- 5月15日雅思大作文真题参考范文 I 保持身体
- 3分钟学会一个雅思7分句(第89期)
- 3分钟学会一个雅思7分句(第88期)
- 5月8日雅思大作文真题参考范文|年年驾考,
- 雅思写作致命错误是什么
- 雅思作文常用词汇介绍
- 3分钟学会一个雅思7分句(第87期)
- 3分钟学会一个雅思7分句(第86期)
- 3分钟学会一个雅思7分句(第85期)
- 4月26日雅思大作文真题参考范文 I 国际快餐
- 4月17日雅思大作文真题参考范文 | 为什么节
- 3分钟学会一个雅思7分句(第84期)
- 雅思写作衔接词使用常见问题
- 题的不写法
- 三步带你搞定流程图