支招小作文 | 如果柱图有未来~
2019年11月24日 10:27来源:昆明编辑
摘要:支招小作文 | 如果柱图有未来~
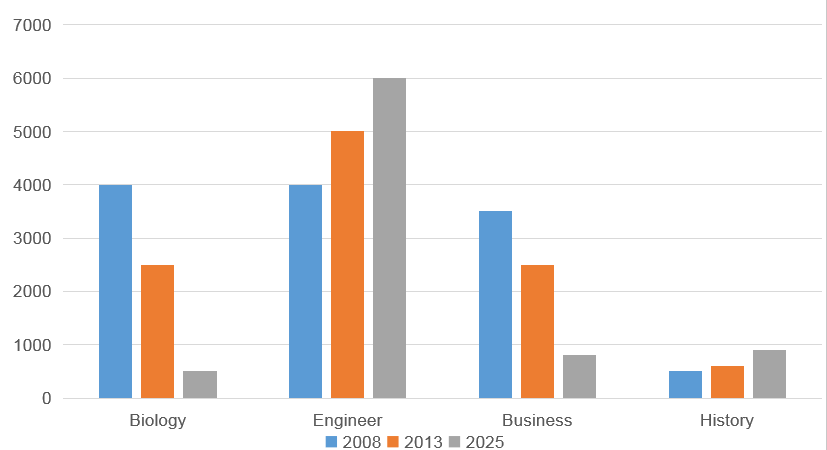
雅思小作文题目
The chart below shows the changes in the number of students applying four different kinds of courses in a university between 2008 and 2025. Summarise the information by selecting and reporting the main features, and make comparisons where relevant. 重要的事情说三遍。 这是遍:不是线图,不可以当成线性概念来写。 The bar chart displays the popularity of four areas of study at a university. 不是线图,不可以当成线性概念来写(第二遍)。Two historical years (2008 and 2013) are investigated, and they are compared with a future year (2025). 不是线图,不可以当成线性概念来写(第三遍)。 所以,笔者用单独一段写完过往所有(四个专业在两个过往的年份)。 In the two historical years, Biology, Engineering and Business weremarkedly more popular than History, and Engineering was the most desired field in 2013 with 6,000 applicants for it, and one of two most popular – the other is Biology – in 2008 with 4,000 applicants. It is also notable that applicants, in the year of 2013, wanted to study Business as much as they wanted to study Biology, and the numbers were both roughly 2,500. History, in both of the two past years, received merely fewer than 1,000 applications. 再单独一个段落纯粹写将来。 The year of 2025, according to the forecast, will see a changed pattern, particularly in the popularity of Biology and Business. It is predicted that these two realms will not receive more than 1,000 applications. Meanwhile, Engineering, with the projected number of 6,000 students aiming for it, will remain most popular, whereas the popularity of History will stay at a low level. Overall, 不是线图,不可以当成线性概念来写(第四遍,因为可能三遍还不够)。the future pattern of how many students apply for the four areas is predicted to bevastly different from the past. 
免责声明
1、如转载本网原创文章,请表明出处;
2、本网转载媒体稿件旨在传播更多有益信息,并不代表同意该观点,本网不承担稿件侵权行为的连带责任;
3、在本网博客/论坛发表言论者,文责自负。
相关内容
- 雅思写作三要素
- 雅思写作十大扣分点
- 基本结构写作技巧
- 作文怎么写结尾
- 雅思写作考试技巧
- 5月15日雅思大作文真题参考范文 I 保持身体
- 3分钟学会一个雅思7分句(第89期)
- 3分钟学会一个雅思7分句(第88期)
- 5月8日雅思大作文真题参考范文|年年驾考,
- 雅思写作致命错误是什么
- 雅思作文常用词汇介绍
- 3分钟学会一个雅思7分句(第87期)
- 3分钟学会一个雅思7分句(第86期)
- 3分钟学会一个雅思7分句(第85期)
- 4月26日雅思大作文真题参考范文 I 国际快餐
- 4月17日雅思大作文真题参考范文 | 为什么节
- 3分钟学会一个雅思7分句(第84期)
- 雅思写作衔接词使用常见问题
- 题的不写法
- 三步带你搞定流程图
