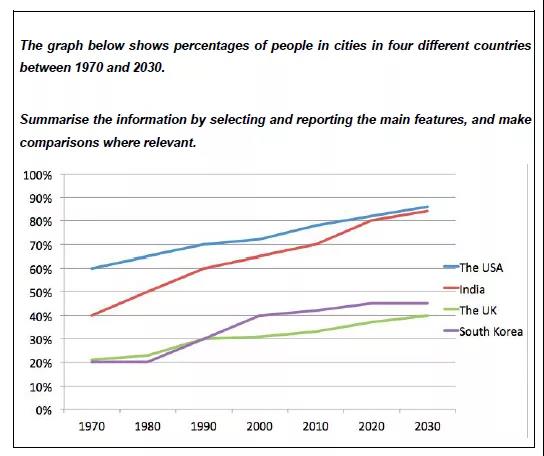
The graph below shows percentages of people in cities in four different countries between 1970 and 2030.
Summarise the information by selecting and reporting the main features, and make comparisons where relevant.
教师示范 注意:时间轴:从过往到将来 对应时态: 1、 现在完成时:可以描述从过往到现在, 2、 一般将来时。 信息分组(根据线的位置): 组1:The US and India, 组2:The UK and South Korea。 Introduction 略。 Body 整体性描述 (如果线形不复杂,就不要把线拆成多个线段来描述,不然会很繁杂):Both the US and India have since 1970 witnessed the growing proportion of the urban population, and with India’s growth that has been faster than America’s, the countries’ urban populations have both reached a high level (80 percent). It is forecasted that the next decade will see a 5-percent further increase in both countries. 整体性描述 (不要用多个句子描述多个线段,而把一些线段用状语形式描述):After the 10-year stability at 20 percent, South Korea’s urban population burgeoned to 40 percent, and since then, it has slowly grown by 5 percent. In the future, the percentage is projected to stabilize. Having also started at 20 percent, the UK’s urban population grew steadily, and the present level is just below 40 percent and under South Korea’s current level. In the next decade, although the UK is expected to have a further growth, it will not overtake South Korea. conclusion Overall, The US and India have obviously had greater portions of the urban population than The UK and South Korea, and the situation is likely to remain until 2030. 